A small introduction to Process Explorer
Process Explorer is a SysInternals utility that is pretty much advanced version of in-built Task Manager. It can be downloaded from Microsoft TechNet website from here. This article is aimed to cover main features of this powerful tool in detail.
Process Tree
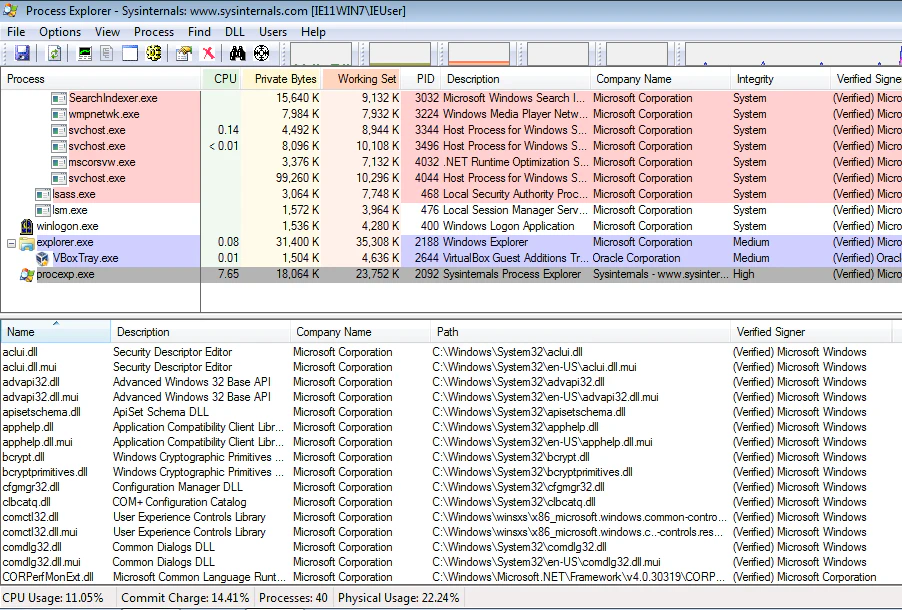
The main window of Process Explorer looks like this:
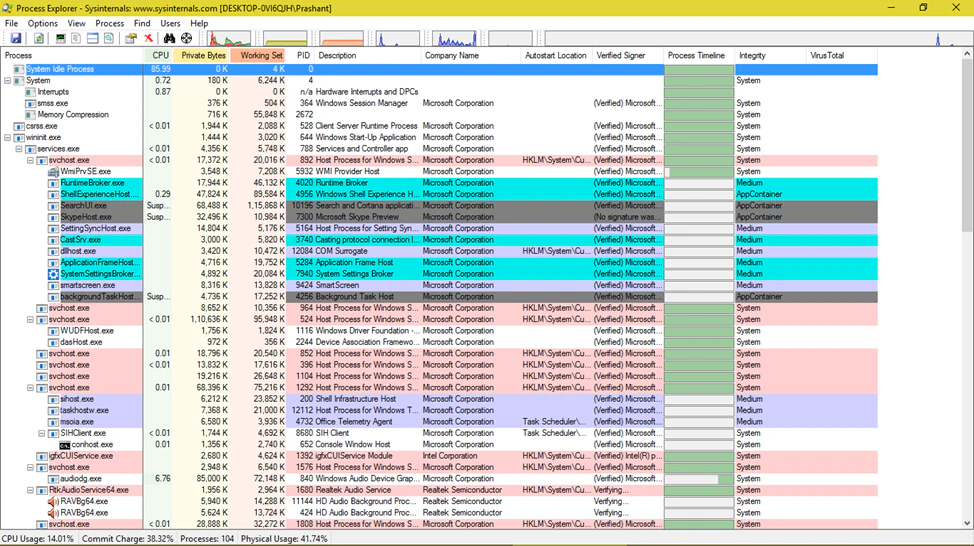
The very first thing to notice about this process tree is that it looks somewhat similar to Task Manager’s Details tab, but much more colourful. The Process column of the window lists all the running processes in a tree structure demonstrating the parent-child relationship of the processes. For example, all the svchost.exe are child of services.exe. It also shows the icons of all the running processes. If you want to sort the list alphabetical order of process names (like in Task Manager) then simply click on Process column title. Click again to reset the tree structure back.
Parent-child relationship: If a process a.exe starts b.exe then a.exe parent of b.exe. For example, if you open Notepad from start menu (which is Windows Explorer) then explorer.exe is the parent of notepad.exe.
Many processes are highlighted in different colours. Here is what they mean:
- Pink: Process is hosting a service.
- Blue: Process is running in the same security context as Process Explorer is.
- Cyan: Windows Store apps.
- Green: New Process shows up in Green for a second.
- Red: Process that ends shows up in Red for a second, then it disappears from tree.
- Grey: Suspended processes.
- Dark Blue: Packed Images.
- White: Process meets no criteria mentioned above.
The default colours can be changed from Options –> Configure Colours.
Not just ordinary tooltip!
The tooltip that comes on hovering over process names contains lot of information about the process.
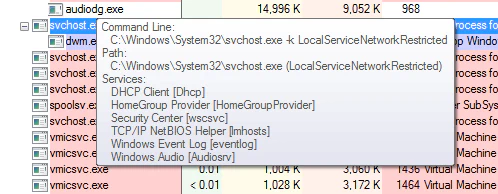
The above example shows tooltip of svchost.exe process. Tooltip contains the Command Line used to start the process and path to the image. It also shows some other process specific details like the services hosted by the process or package name for Store apps or WMI providers for WMI process.
Too many columns
Process Explorer can display so many details in this list of processes that all the columns were divided in groups. The columns to be displayed can be selected by right clicking on any column title and selecting ‘Select Columns’. A dialog box looking like this will appear.
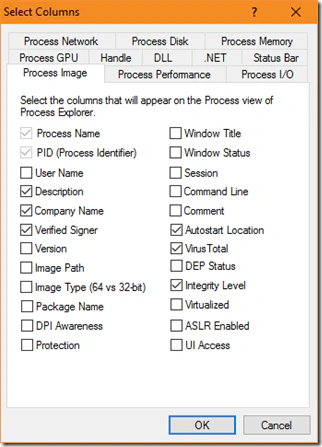
Select the columns to be displayed and click OK.
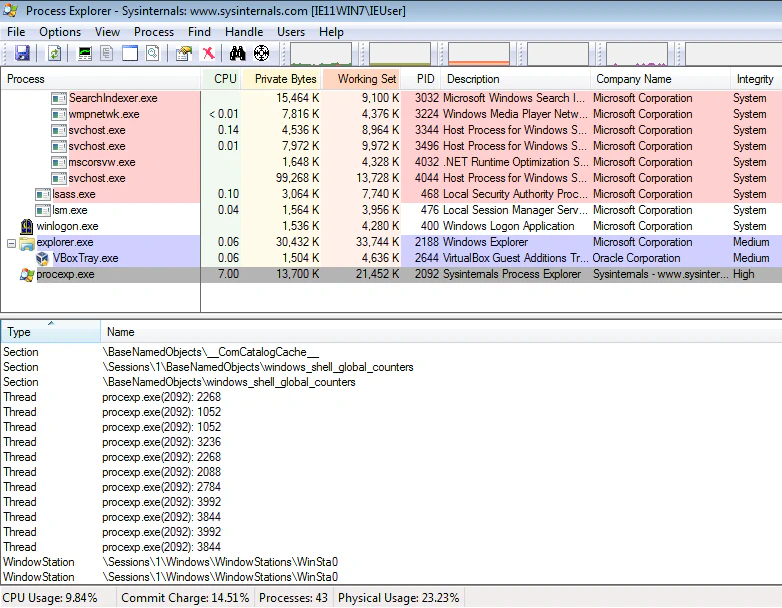
The Lower Pane
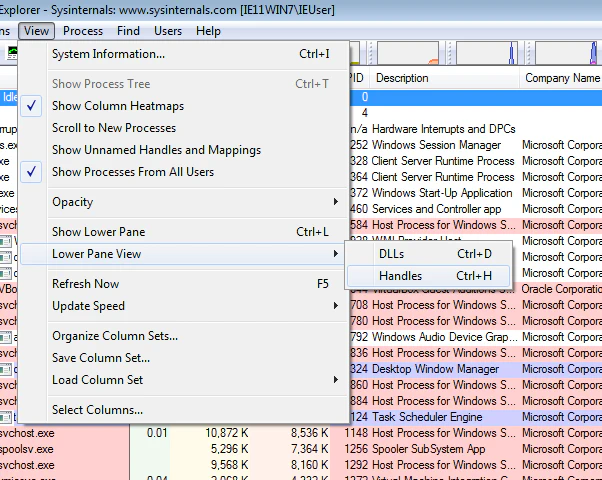
One of the very powerful feature of Process Explorer is its Lower Pane. The Lower Pane can be used to view Handles and DLLs linked to a process. To view Lower Pane, move to View menu and select ‘Show Lower Pane’ option. Right below it, their is an option of selecting whether Lower Pane will show Handles or DLLs.
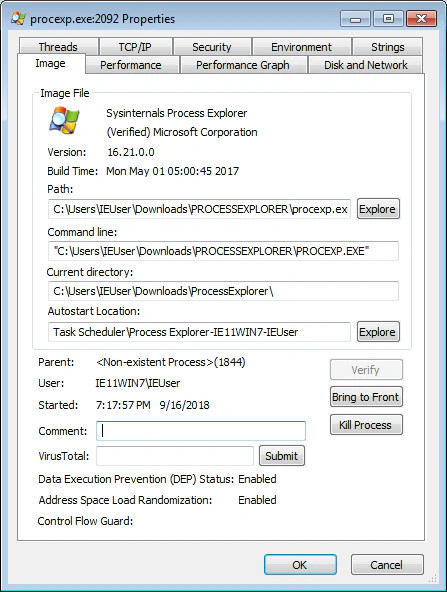
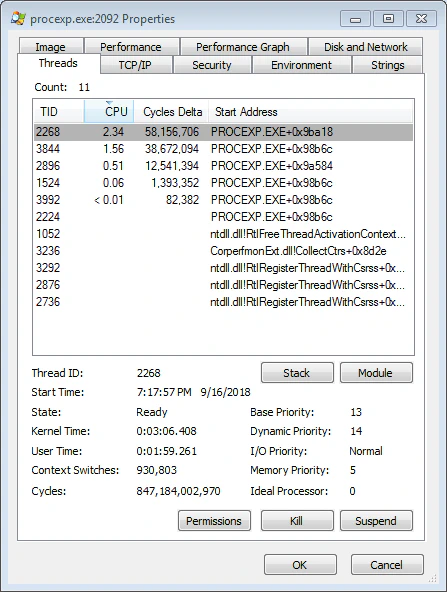
Process Properties
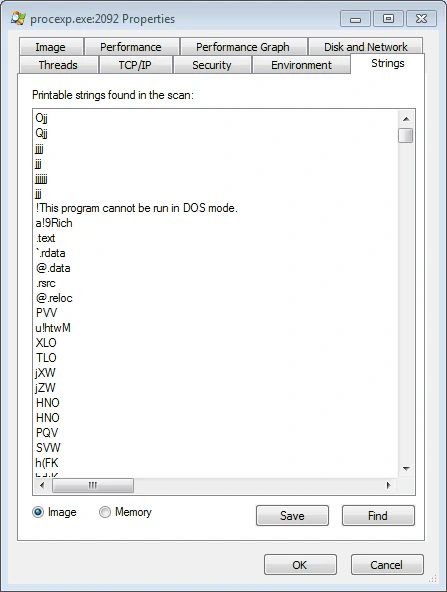
Properties window of a process in Process Explorer contains very rich information about the process. This information includes basic information like name, version, path, autostart location, DEP/ASLR status but also some pretty cool stuff like open threads (with thread stacks), security context, strings for both image and memory, environment variables and lot more.
Verifying Images and VirusTotal scan
You can verify Image Signatures automatically when Process Explorer starts. To do this, go to Options –> Verify Image Signatures.
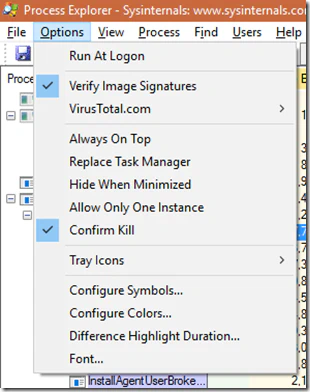
This option comes handy when you have to quickly analyse whether the running processes are legitimate or not. Also, Process Explorer now comes with option to automatically scan images too. Go to Options –> VirusTotal.com –> Check VirusTotal.com to submit hash of all the running executables to VirusTotal’s engine and fetch the results. You can click on Submit Unknown Executables in the same sub-menu to upload and scan the image if its hash is not already available in VirusTotal’s database.
Tray Icons
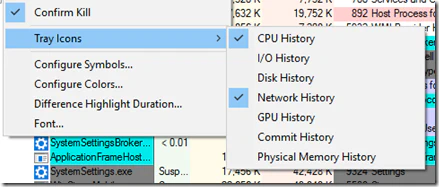
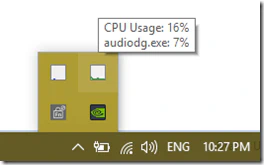
Process Explorer provides many Tray icons as opposed to Task Manager that shows only CPU History (although tooltip shows all four performance metrics). You can enable each Tray icon by selecting them in Options –> Tray Icons. These tray icons show some icon-specific details in tooltip. For example, CPU History Tray icon shows CPU usage percentage as well as process consuming highest CPU, as shown in image below.
Always on Top
Always on Top feature keep the Process Explorer window on the top of other windows. If you run any other application, Process Explorer will still be there on top of it. This option can come handy when analysing performance impact of starting any application.
Replace Task Manager
Replace Task Manager option replaces the in-built Task Manager with Process Explorer. So, next time you launch Task Manager, you’ll see Process Explorer instead of Task Manager.
Related Posts
Attacking Kerberos: Resource Based Constrained Delegation
Now that we are done with Unconstrained and Constrained Delegations, it is time for the finale. In this blog we’ll discuss Resource Based Constrained Delegation (RBCD).
Read moreAttacking Kerberos: Constrained Delegation
In the last blog, we discussed Unconstrained Delegation in detail. We also saw how dangerous Unconstrained Delegation can get. Unconstrained Delegation was the very first implementation of Delegations, introduced back in Windows Server 2000.
Read moreAttacking Kerberos: Unconstrained Delegation
So we are going to talk about Unconstrained Delegation in this blog. I have already covered a small introduction to Delegations and the Kerberos concepts you’d need to understand it in an introduction blog.
Read more